|
▼ MacOS X でオープンソース( Open Source )や優れたフリーウェア( Free Ware )を活用すべく、スクリプト言語グラフ表示のフリーソフトのコンパイルし、使用してみました。
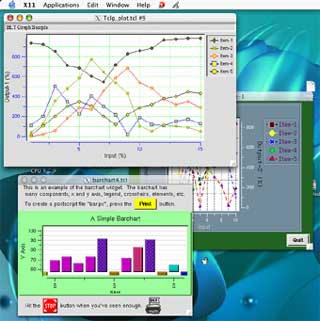
▼ MacOS X でも、利用可能なクラブ表示ソフトのBLTはTcl / Tkのスクリプト言語に対応した拡張ソフトの実用的なソフトです、MS-EXCELなどの商用ソフトを使用せずとも、簡単にプログラミングが可能です、グラフのスクリプトを作成し即bltwishのインタープリンターで実行できて大変便利です、下記はそのbltwishでサンプルのグラフ・スクリプトを表示したスクリーンショットです。

フリーウェアを馬鹿にしてはいけません、決して利用できないことはないのです、BLTはTcl / Tkとの併用で本格的なビジネス・アプリケーションの開発も可能です、Tcl / TkはC言語とのリンケージが可能でありC言語作成した関数をTcl / Tkからコールも可能であり、又その逆も可能です、Tcl /Tkを応用した商用アプリ・ソフトは多数存在します。
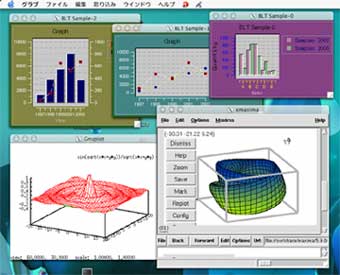
下記はTcl / Tk応用のBLT と MAXIMA, gnuplotの2D & 3Dグラフを表示したスクリーンショットです。

MS-VB(VisualBasic)でグラフ表示のソフトをプログラミングすることは決して簡単ではありません、BLTの機能はグラフの表示部分をマウスで範囲選択すると自動的にその部分が拡大表示する機能など大変便利です、この機能をVBでプログラミングすれば数千行のソースコードとなるでしょう・・・。
又、グラフ表示部分に簡単にgiff画像を張り付けできる機能もあり、他にも折れ線グラフや棒グラフなどを表示するだけでなく便利な機能があり、実用的なアプリ・ソフトを開発できます。
◆ BLTのコンパイルと実行方法
(1) 必要なソフト
入手すべきSource Files, Object Files、及びTools
AppleComputer社のDevelopment Toolsが必要です、MacOS Xのパッケージを購入すれば、
そのCD-ROMの中に開発Toolsが入っています。
AppleComputer社のX11on MacOS X beta版が必要であり、X Window SystemでのGUI表示となります。
fink-0.5.3-Installer.dmgのバイナリ・ソフトが必要。
他のソースファイル : tcl-8.4.1-src.tar.gz, tk-8.4.1-src.tar.gz
BLT2.4z.tar.gz
(2) Tcl/TkとBLTは、Fink でconfigure, make installでコンパイルする。
/sw/src/へ必要なソース・ファイルをコピーする。
%cd /sw/src/
%fink install tcltk
%fink insatll BLT
/sw/bin/bltwishが生成されます。
X11を起動後、X11のxtermでcd /sw/を実行後、bltwish /sw/***.tcl &としBLTのTclスクリプト
とコマンド入力でBLTを実行する。
又X11のApplicationメニューにbltwish /sw/sample.tcl &を登録すれば簡単に起動できます。
◆ BLTのサンプル・グラフ表示スクリプト・ソース
上記の折れ線グラフのスクリプト・ソースです、かずか百数十行でグラフのズーム機能もあり、グラフのリサイズもグラフ表示中に可能であり、マルチスレッドなど意識する必要がありません、MS-VBであればマルチスレッドプログラミングが必要ですが、残念ながらMS-VBはマルチスレッド・プログラミングができないため、VC++とも併用が必要となりソフト開発時間も多くの工数が必要でしょう・・・、つまり開発効率が悪いのです。
下記のソース内の改行コード"\"を逆スラッシュに変更しないと実行できないかもしれませんが、ブラウザからテキスト形式でコピーすれば実行可能です。
#!../src/bltwish
package require BLT
if { $tcl_version >= 8.0 } {
namespace import blt::*
namespace import -force blt::tile::*
}
set visual [winfo screenvisual .]
if { $visual != "staticgray" && $visual != "grayscale" } {
option add *Button.Background red
option add *TextMarker.Foreground black
option add *TextMarker.Background yellow
option add *LineMarker.Foreground black
option add *LineMarker.Background yellow
option add *PolyMarker.Fill yellow2
option add *PolyMarker.Outline ""
option add *PolyMarker.Stipple fdiagonal1
option add *activeLine.Color red4
option add *activeLine.Fill red2
option add *Element.Color purple
}
option add *Button.Tile ""
option add *Text.font -*-times*-bold-r-*-*-12-*-*
option add *header.font -*-times*-medium-r-*-*-12-*-*
option add *footer.font -*-times*-medium-r-*-*-1-*-*
option add *HighlightThickness 0
set graph [graph .g]
proc FormatAxisLabel {graph x} {
return "[expr int($x)]\260"
}
set configOptions [subst {
Axis.Hide no
Axis.Limits "%g"
Axis.TickFont { helvetica 12 bold }
Axis.TitleFont { helvetica 12 bold }
BorderWidth 1
Element.Pixels 1.75m
Element.ScaleSymbols yes
Font { helvetica 14 bold }
Legend.ActiveBorderWidth 2
Legend.ActiveRelief raised
Legend.Anchor ne
Legend.BorderWidth 0
Legend.Font { Helvetica 14 }
Legend.Position plotarea
Relief sunken
Title "Sine and Cosine Functions"
x.Command [namespace current]::FormatAxisLabel
x.StepSize 90
x.Subdivisions 0
x.Title "X"
y.Color purple2
y.Loose no
y.Title "Y"
y.rotate 90
y2.color magenta3
}]
set resName [string trimleft $graph .]
foreach { option value } $configOptions {
option add *$resName.$option $value
}
set x_data {1 2 3 4 5 6 7 8 9 10 11 12 13 14 15}
set PlotData0 {3040 4563 3512 7328 4684 5879 6003 8500 9200 9050}
set PlotData1 { 940 928 857 713 689 607 550 720 830 860 890 972 980 989 990}
set PlotData2 { 40 128 357 480 589 777 650 540 430 103 50 120 100 90 50}
set PlotData3 { 0 18 57 180 289 270 460 590 690 540 490 380 320 350 290}
set PlotData4 { 110 203 504 350 230 405 302 220 20 190 120 110 150 170 130}
set PlotData5 { 10 106 200 300 350 305 202 120 220 290 320 380 400 450 430}
$graph configure -leftvar changed
set tcl_precision 15
$graph element create line1 \
-label "Item-1" \
-fill orange \
-color black \
-symbol plus \
-xdata $x_data \
-ydata $PlotData1
$graph element create line2 \
-label "Item-2" \
-color yellow4 \
-symbol cross \
-fill yellow \
-xdata $x_data \
-ydata $PlotData2
$graph element create line3 \
-label "Item-3" \
-color red \
-symbol diamond \
-fill yellow \
-xdata $x_data \
-ydata $PlotData3
$graph element create line4 \
-label "Item-4" \
-color blue \
-symbol square \
-fill yellow \
-xdata $x_data \
-ydata $PlotData4
$graph element create line5 \
-label "Item-5" \
-color black \
-symbol circle \
-fill yellow \
-xdata $x_data \
-ydata $PlotData5
Blt_ZoomStack $graph
Blt_Crosshairs $graph
Blt_ActiveLegend $graph
Blt_ClosestPoint $graph
#Blt_PrintKey $graph
$graph postscript configure \
-maxpect yes \
-landscape yes
$graph axis configure x -color blue -min {} -max {} \
-color blue -title "Input (%)" -titlecolor #232221 \
-showticks 1
$graph axis configure y -color blue -min {} -max {} -hide no -showticks 1 \
-title "Output-1 (%)" -showticks 1
$graph grid configure -hide no -color green -dashes {2 2}
htext .header -text { Graph Quit %%
set im [image create photo -file ./images/stopsign.gif]
button $htext(widget).quit -image $im -command { exit }
$htext(widget) append $htext(widget).quit
%%}
htext .footer -text { }
table . \
.header 0,0 -fill x -padx 1 -pady 1 \
$graph 1,0 -fill both \
.footer 2,0 -fill x -padx 1 -pady 1
table configure . r0 r2 -resize none
bind $graph <Shift-ButtonPress-1> {
MakePsLayout $graph
}
◆ コンピュータと制御関係のページ
制御関係のコンピュータとリアルタイムOS関係はこちらのページです。
組込みMPU関係のページはこちらです、又PC & PDA 用CPU関係はこちらのページです。
PowerPC 関係のページはこちらです。
MacOS X & X serve関係、他にはない情報のページはこちらです。
弊社の製品 弊社の低価格なボード・ソフト製品一覧
トップページへ戻り
◆ このページへはご自由にリンクして下さい、その際Eメールでご感想などをご連絡戴ければと思います。
|

